LatencyLab is a local, design-time latency simulator for event-driven systems.
A Small Tool for Uncomfortable Performance Truths
Latency discussions are dominated by intuition, confidence and post hoc profiling. By the time real systems can be measured, critical decisions about concurrency, feedback, sequencing and delay have already been made and are difficult to reason about without invasive instrumentation or significant rewrites.
Profilers explain what happened in a running system. They rarely explain why the user waited.
LatencyLab exists because reasoning about latency after the fact is too late.
It is not a profiler. It is not a tracer. It is not a runtime observer. LatencyLab is a design time simulation engine built to prevent confident people from shipping bad architecture.
If this output surprises you, that is the point.
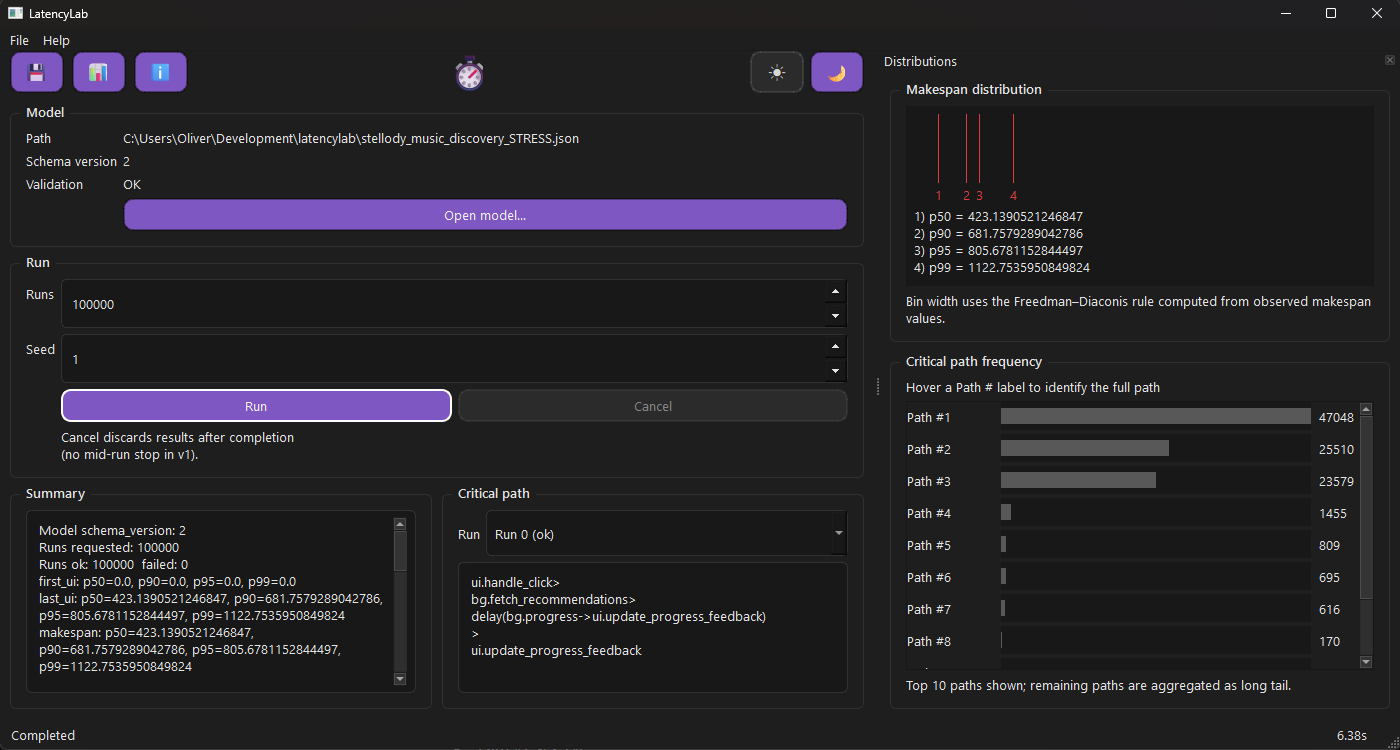
The UI shows exactly what the model produced and nothing it did not.
Problem → System → Outcome
Problem
Most performance discussions happen too late and with too much confidence. By the time a system is observable, architectural decisions about concurrency, feedback and sequencing have already hardened. Profiling can explain where time went but it struggles to explain why the system felt slow to a user.
Solution
LatencyLab executes explicit models of tasks, events, queues, delays and resource contention using deterministic scheduling and reproducible randomness. These models are run many times to produce concrete metrics such as critical paths, queue wait, UI timing and percentiles.
Instead of attaching to running production code, LatencyLab makes delay and coordination visible before code exists.
Outcome. Performance decisions became testable before code existed: teams could point to the model, see where time was actually spent and stop shipping architectures that only worked on whiteboards.
This is how you find the latency problem before it is politically expensive.
The UI is a client, not a comfort blanket
The UI exists because text output alone was not enough to reason about timing, ordering and consequence.
It is intentionally literal. It shows what ran, how often it ran and where time accumulated. Percentiles are separated for UI events and overall makespan because they answer different questions. Critical paths are shown as concrete task sequences because naming work matters more than visual polish.
Accessibility is treated as a constraint, not polish. Brittle tools undermine confidence, especially when the results are inconvenient. Full keyboard navigation forced the interface to become simpler and more honest about what could be interacted with and when.
This was not optional.
Design time, not post mortem
LatencyLab is not for tuning code.
It is for validating architectural decisions before they harden.
If you have ever said “we will profile it later”, this is what later should have looked like.
This tool forces explicitness. Tasks, events, queues, delays and feedback paths must be named. Randomness is seeded. Models are versioned. Legacy behaviour is preserved as an executable oracle. When numbers change it is because the model changed, not because the measurement drifted.
The goal is not optimisation. It is understanding.
Who this is not for
LatencyLab is not a profiler replacement.
It will not tell you how to make a function faster.
It does not generate recommendations.
It does not reassure you.
If you want a dashboard that explains why everything is fine, this tool will disappoint you. If you want to optimise code that already exists, use a profiler. If you want to reason about latency without committing to explicit structure, this will feel uncomfortable.
That is intentional.
A five minute betrayal of intuition
The fastest way to understand what LatencyLab does is to start with a system everyone thinks they understand.
A user clicks a button. Background work starts. Progress updates appear. Eventually the result renders.
This example comes from a real application I wrote and shipped, a professional music discovery app. The exact model used to explore this flow lives in the LatencyLab repository:
the music discovery ingest file
This is not a toy example. I use LatencyLab on my own software.
Before running the model, most people predict that the background work dominates perceived latency.
They are usually wrong.
Repeated progress updates, delayed slightly to feel smooth, compete for a single UI thread. They look harmless. They feel responsive. They quietly extend the critical path and delay the one thing the user actually wanted.
LatencyLab makes this visible. The model runs thousands of times and at scale the same dominant behaviours become clearer, not noisier. The critical path names the work. The percentiles show how often the UI thread is busy doing the wrong thing.
There is no argument to win. The output speaks for itself.
Determinism is not optional
Randomness is useful. Undisciplined randomness is not.
Every run is seeded. Behaviour remains reproducible across versions. Legacy behaviour is preserved deliberately, not because it is elegant but because confidence matters more than tidiness.
If this tool does its job, performance discussions become calmer, graphs replace confidence and arguments about why something felt slow quietly disappear.